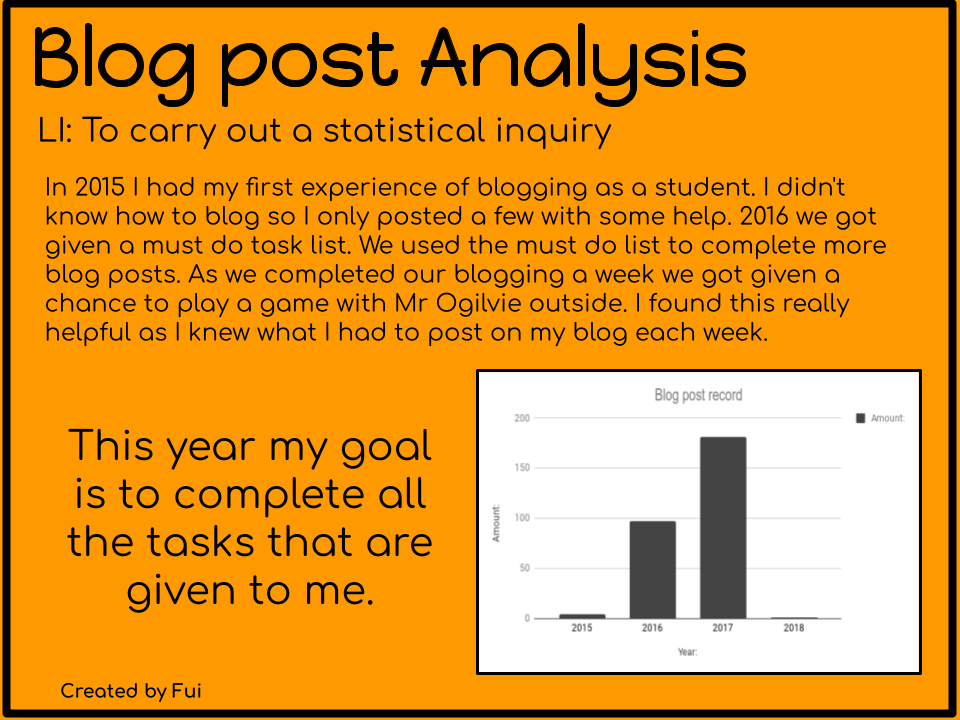

This week I have completed a blog post analysis chart due to my blog posts I have completed each year. I learnt how to carry out a statistical inquiry. First we created a google spread sheet. We then visited our blog post site and gathered information for our chart. Once we have completed making our chart we got to decorate it & Put it onto a Google drawing. Here is my Statistical inquiry. It has my Analysis at the bottom, A title & most importantly My chart.
No comments:
Post a Comment